Halloween Project 2019
This is the project that started the entire series.

Functionality
This was the first halloween project I did with my kids and the goal was to see what was the most popular trick-or-treat candy of the 4 they selected; KitKats, Sour Patch Kids, Twix or Nerds. We placed this cabinet, for lack of a better term, on a folding table in our driveway and placed a bowl of each of the corresponding candies below each arrow. The trick-or-treaters would push the button for their favorite, lights would flash for that candy, the graph would update with their selection on the ipad and they would take the candy from the bowl.
The Build
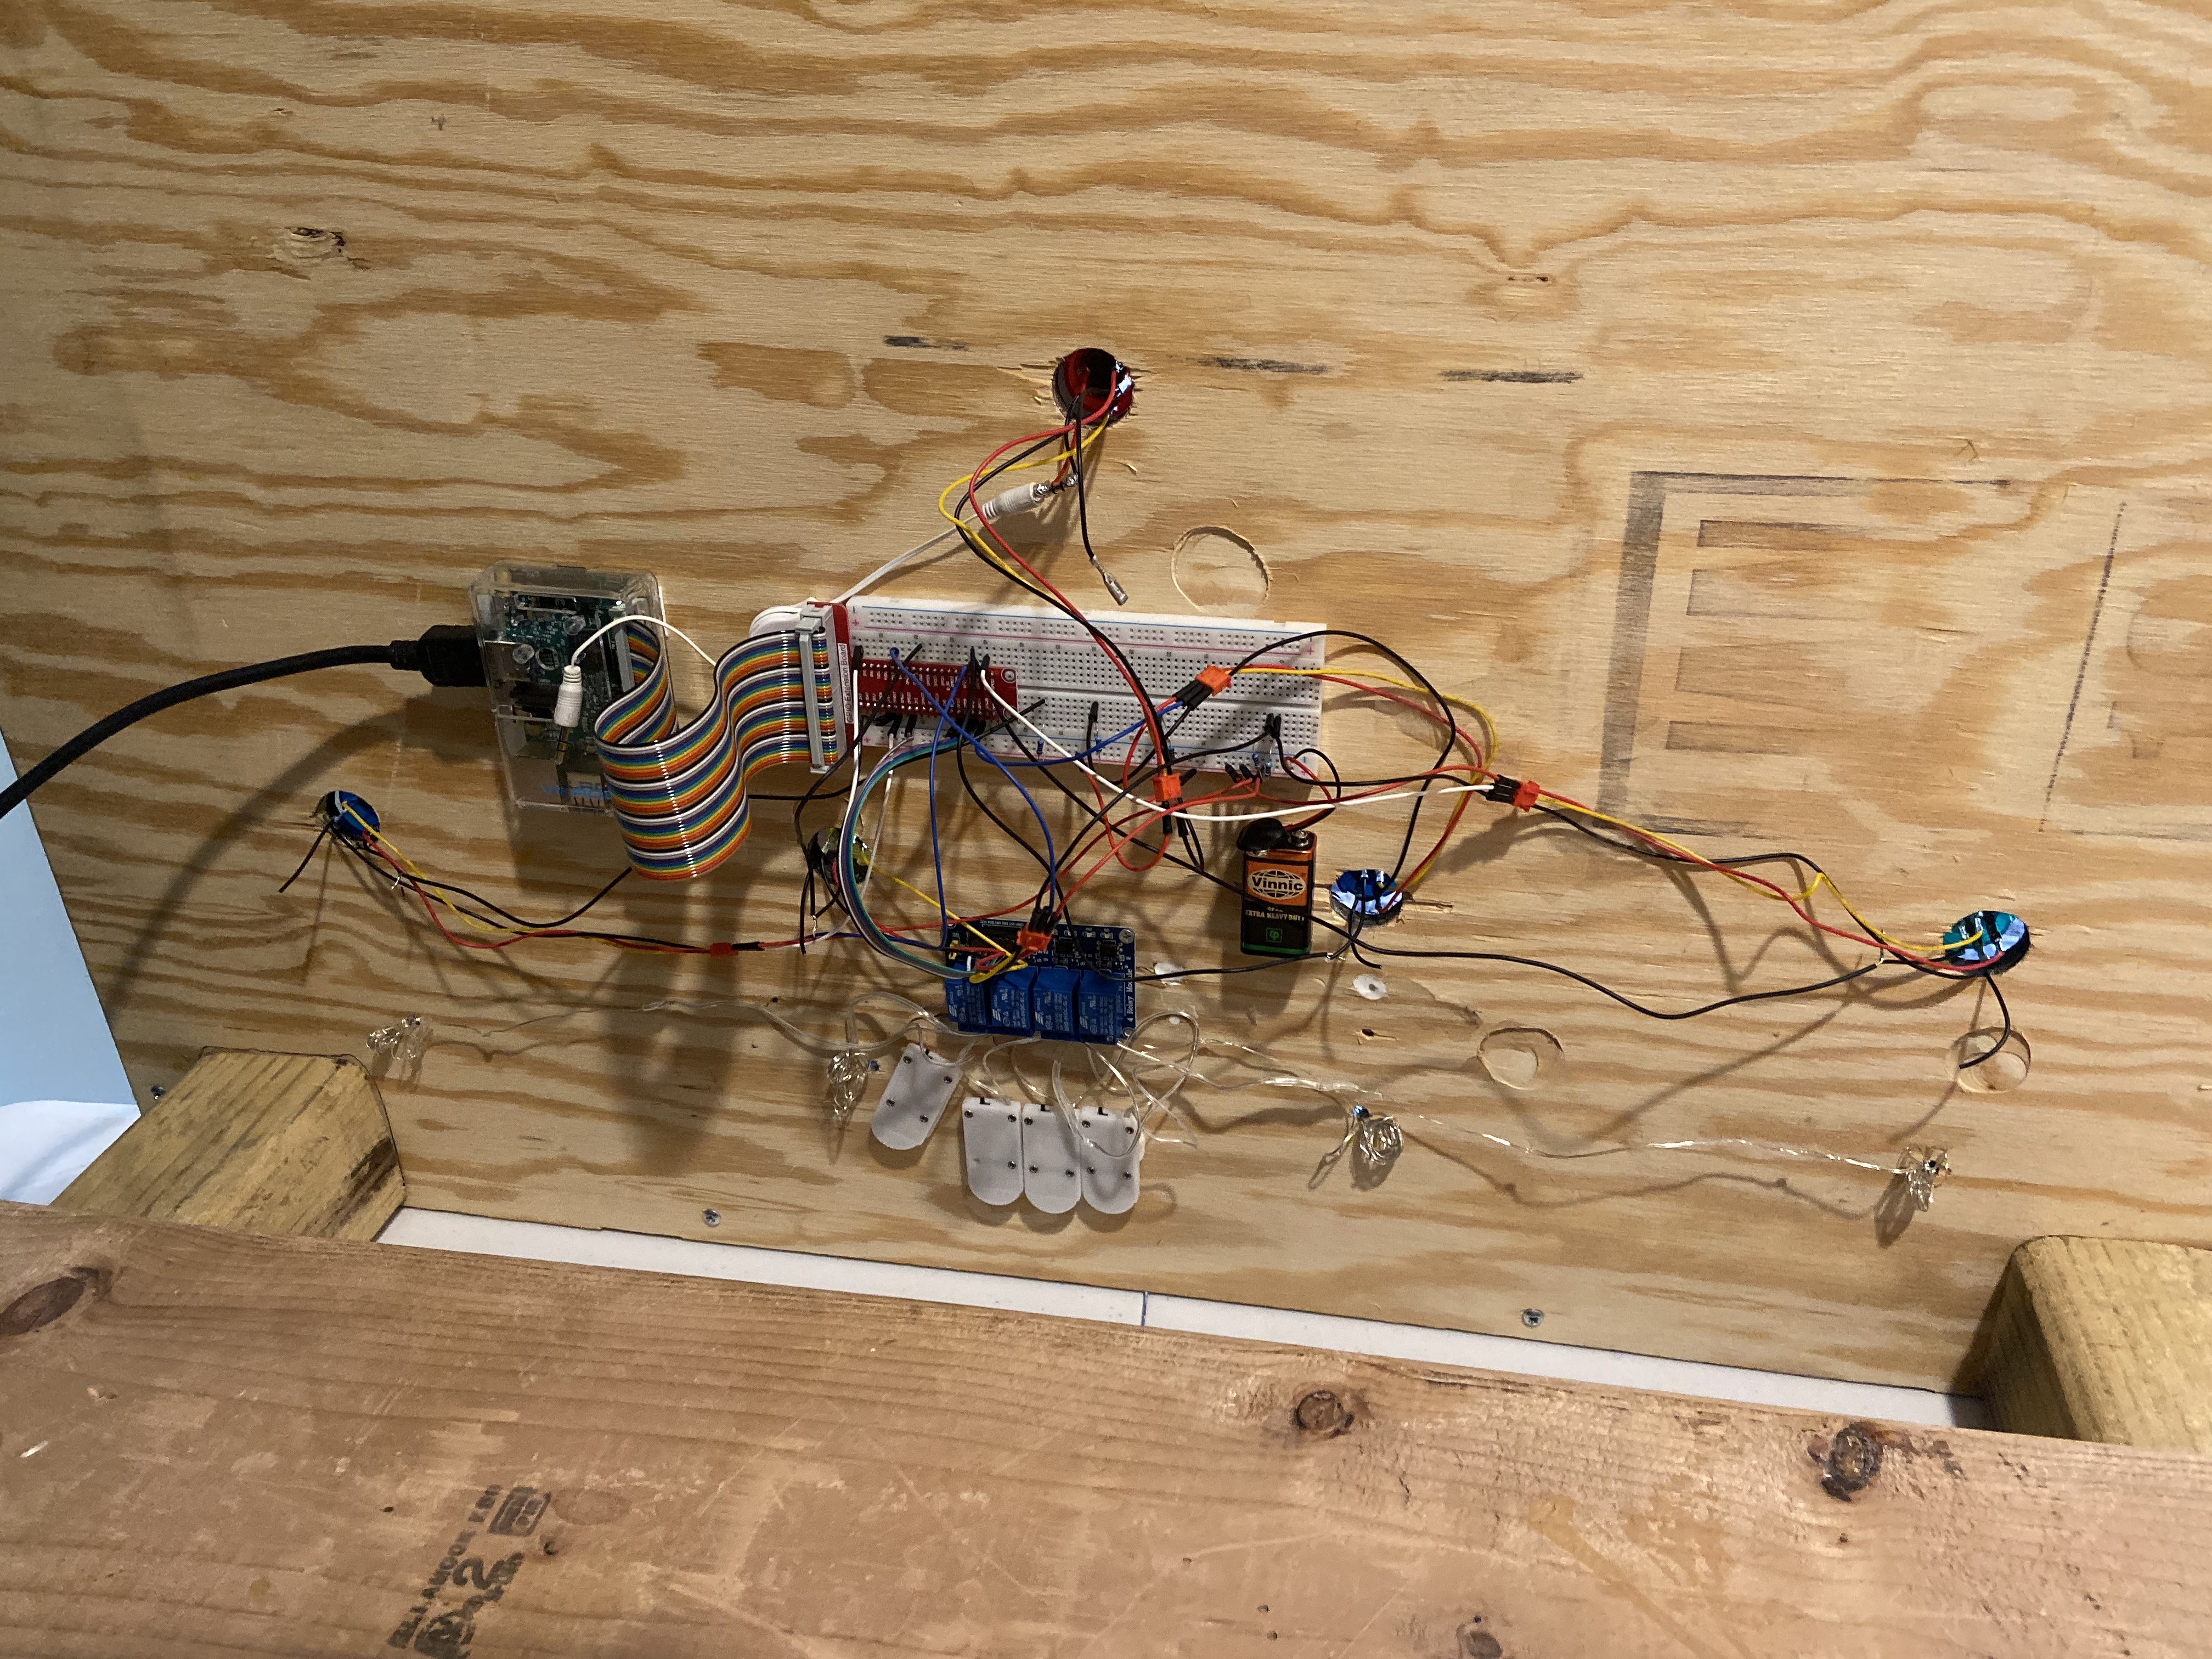
Definitely a bit messy under the hood, but we used a raspberry pi 3 and a breadboard to connect a 4 terminal relay switch, 4 led fairy string lights for the "arrows", and 5 arcade buttons. Python was used as the programming language. When you pressed the button it activated the switch attached to that particular candy's led lights which would flash on and off 6 times, and also updated a google sheets chart which was shown on an ipad in the cabinet.
Linking the Python code to the Google sheet was possible by following "Tech with Tim's" YouTube video referenced at the bottom of page. This was a very exciting discovery and allowed me to use Google sheets as not only a database, but also a real-time data visualization tool.
The red arcade button in the center activated a jumping spider that lept over the cabinet from behind. You probably have seen this spider decoration at a halloween store and we modified the activator to connect to this button rather than the intended pressure sensitive mat that you step on. We also printed a QR code so that, if people were interested in which candy won at the end of the night, they could take a picture of it and it would send them to the google sheet.
The Code
The Python code ran a specific script based on which button was pressed. The buttons were connected to GPIO pins 17,18,19, and 20. The scripts flashed the lights on and off 6 times for that specific candy and also update the google sheet with what candy was selected and a timestamp of when it was pressed. The relay/switch for the lights were connected to GPIO pins 22, 5, 6, and 13 respectively.
The Data
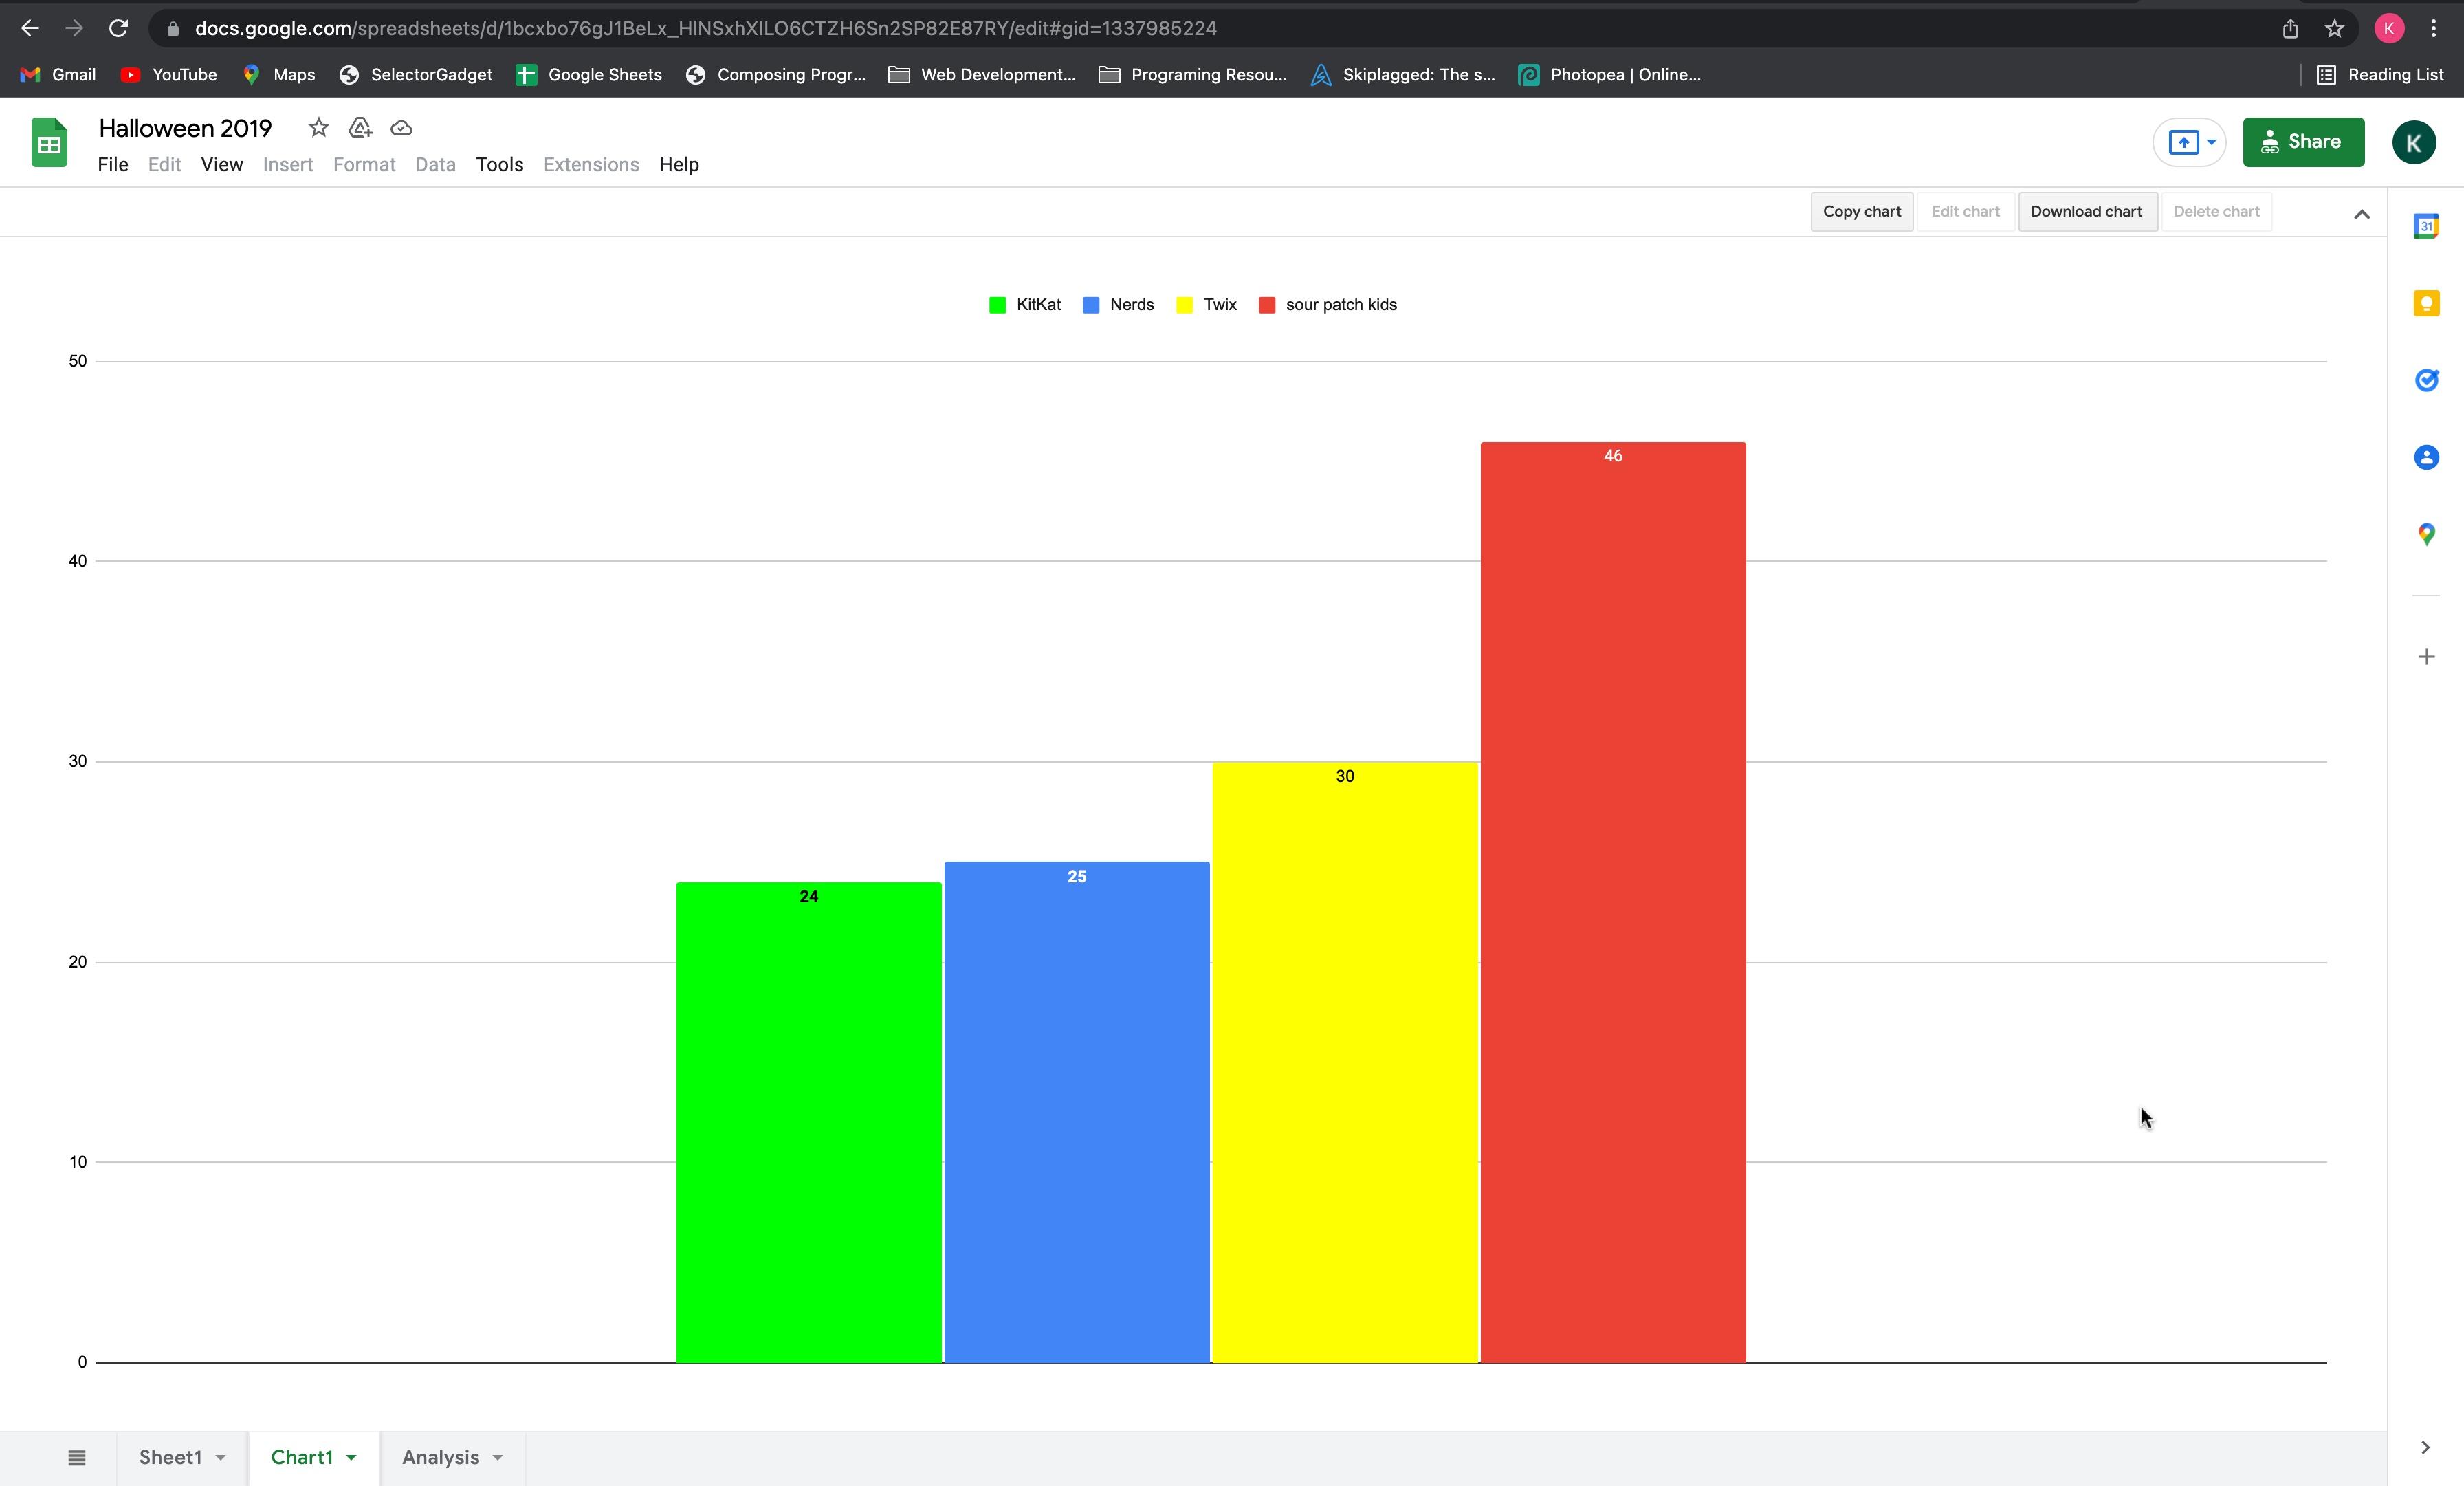
As you can see in the google sheet screenshot above, we tracked the popularity of each of the candies. Some of the trick-or-treaters were amazed that the graph on Google Sheets would update live when they pressed the button for that candy. Almost by magic, no cables to the ipad that displayed the data just a real time update. Afterwards, I analyzed the timestamp when each button was pressed and correlated this to the number of trick-or-treaters within 5 minute intervals, and looked for trends. This data can be seen in the Google sheet in the "Analysis" tab. It was great to see the interest the trick-or-treaters had in the data and after 124 trick-or-treaters there was a clear preference for sour patch kids.
Sources
Credit and thanks for how to link Python to Google Sheets goes to "Tech with Tim - Python Google Sheets API Tutorial - 2019" - Link to YouTube video